01
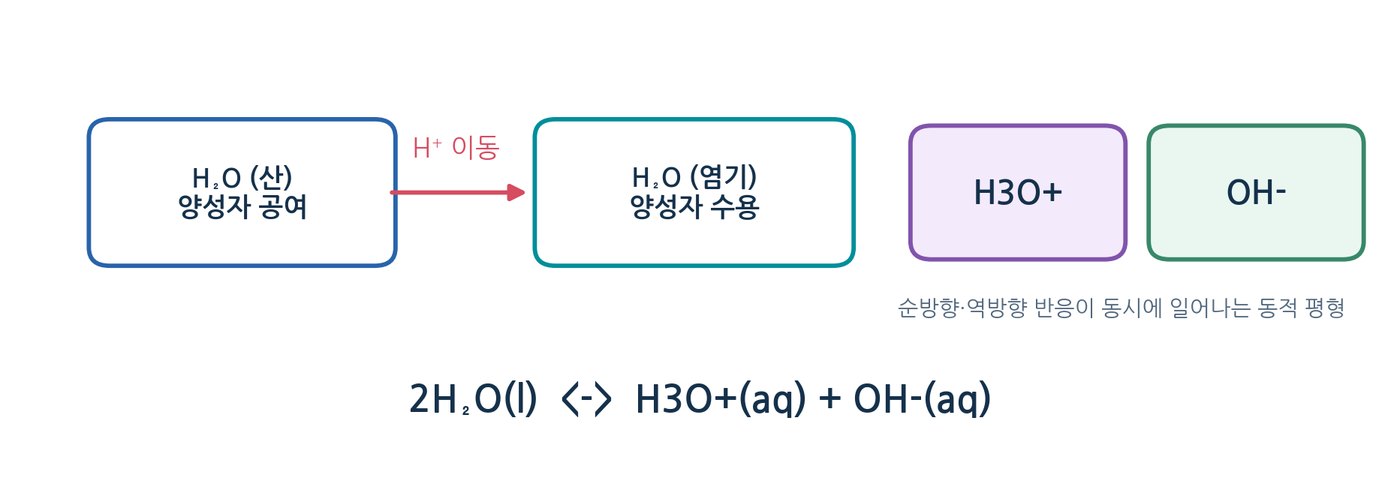
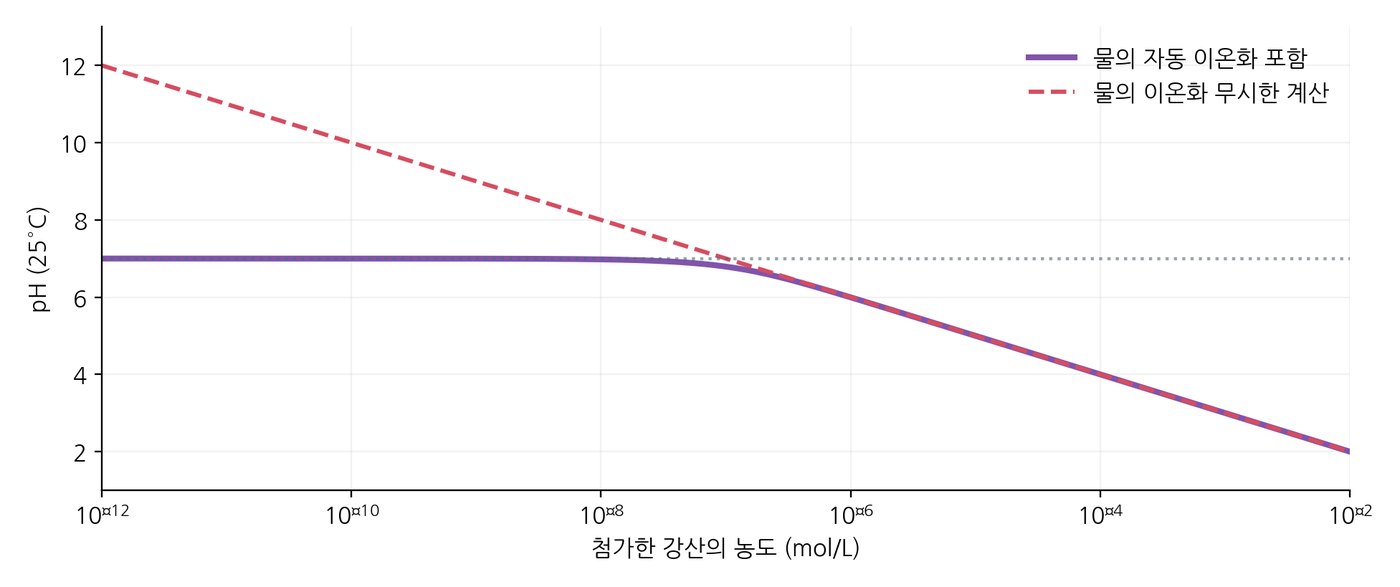
Pure water ionizes only slightly
- A small fraction of molecules transfers a proton to a neighbour, producing H₃O⁺ and OH⁻
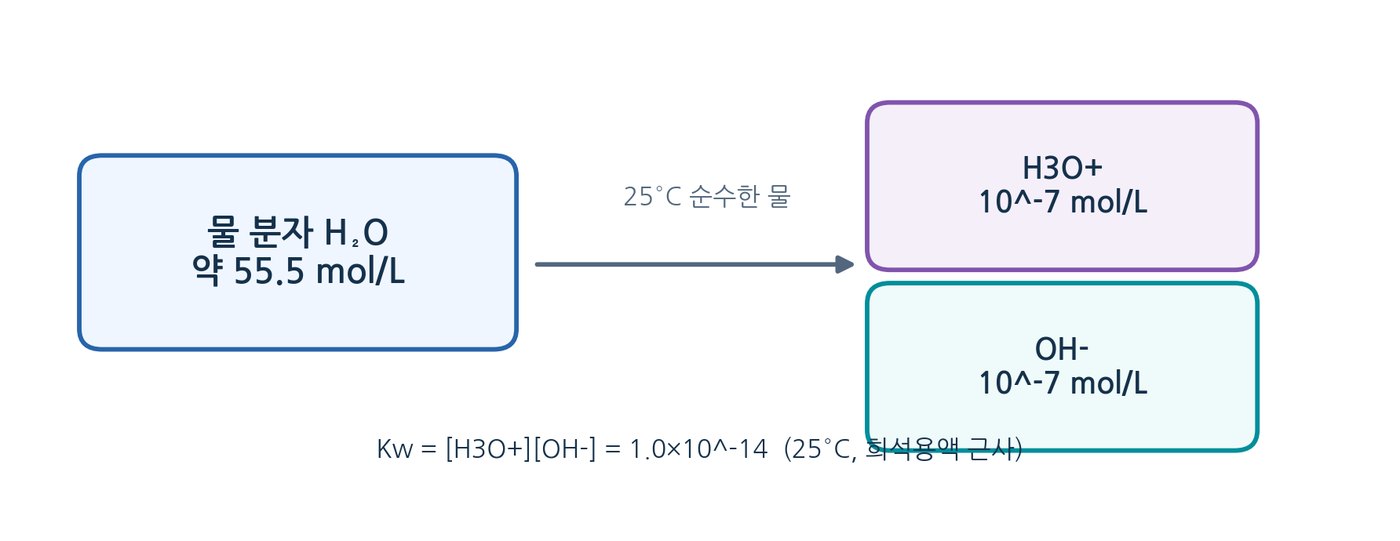
- At 25 °C the concentrations are equal, about 1.0 × 10⁻⁷ M each
- The process is fast and dynamic, not a one-way reaction
02
Ionization of water is expressed by an equilibrium constant
- Kw = [H⁺][OH⁻] = 1.0 × 10⁻¹⁴ at 25 °C
- Kw changes with temperature, so neutrality is not always pH 7
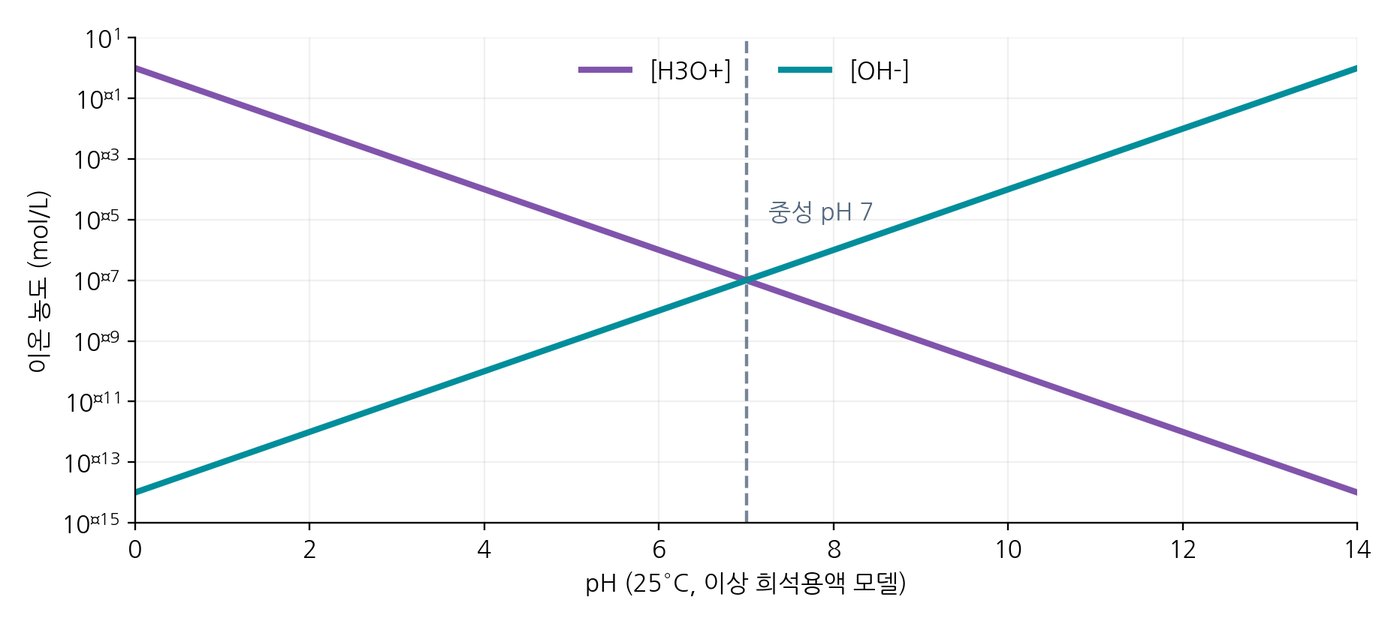
- Adding acid lowers [OH⁻] and adding base lowers [H⁺], keeping the product constant
03
pH expresses the hydrogen and hydroxide concentrations
- pH = −log[H⁺]; pOH = −log[OH⁻]; pH + pOH = 14 at 25 °C
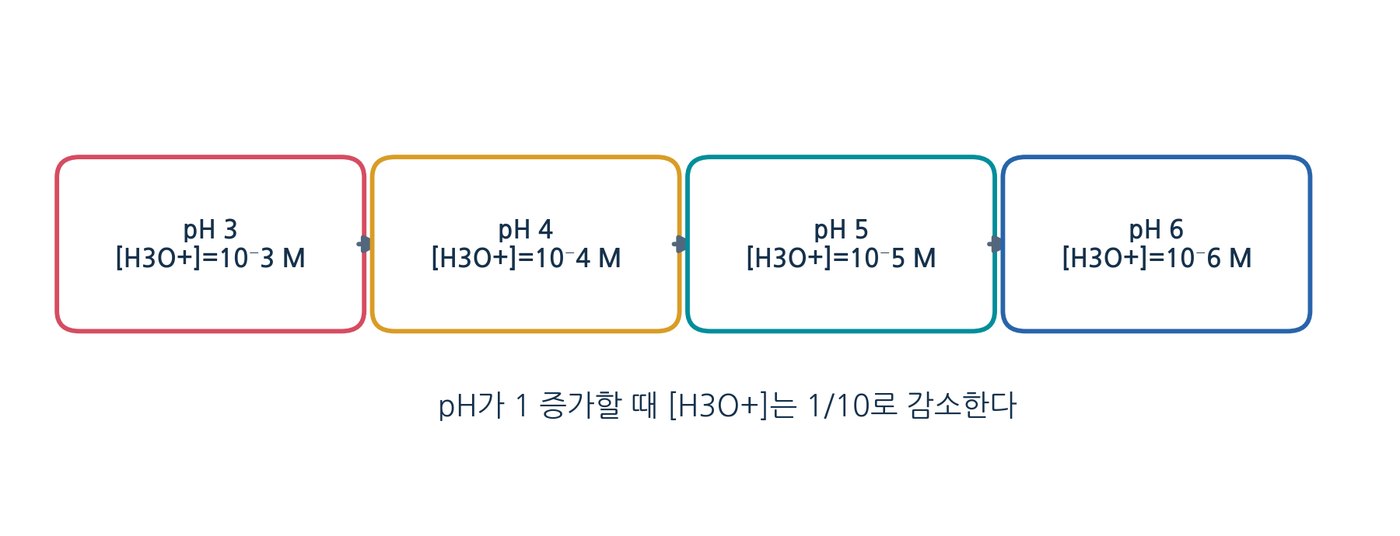
- A change of one pH unit is a tenfold change in concentration
- Biological fluids are held near pH 7.4, with narrower ranges inside compartments
04
Weak acids and bases have characteristic dissociation constants
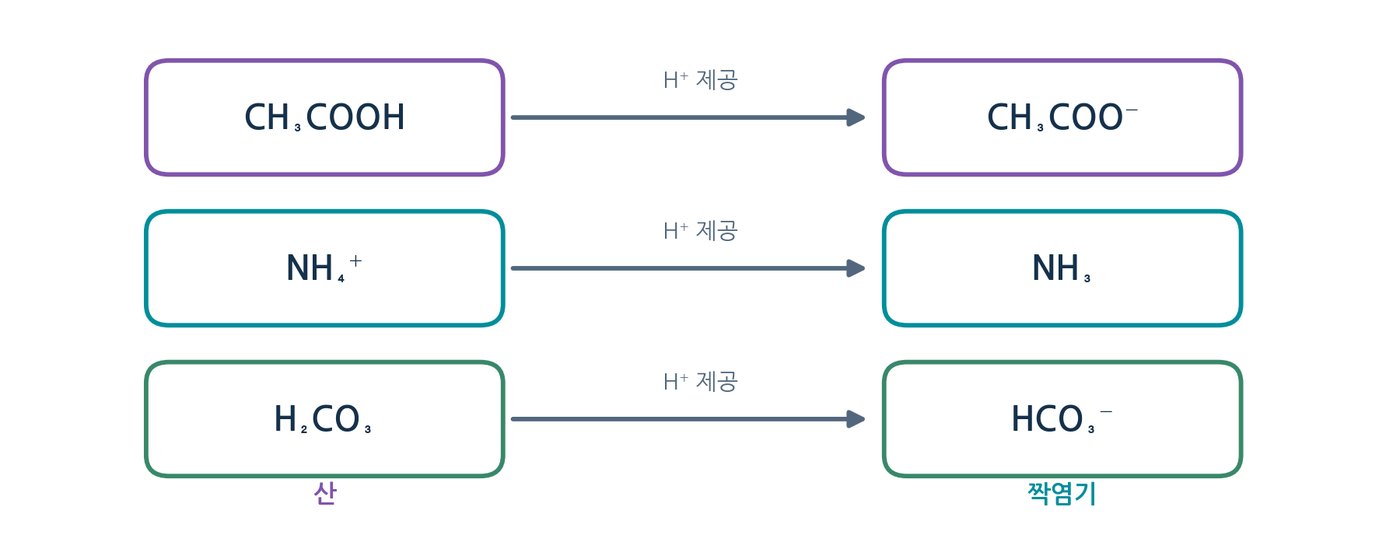
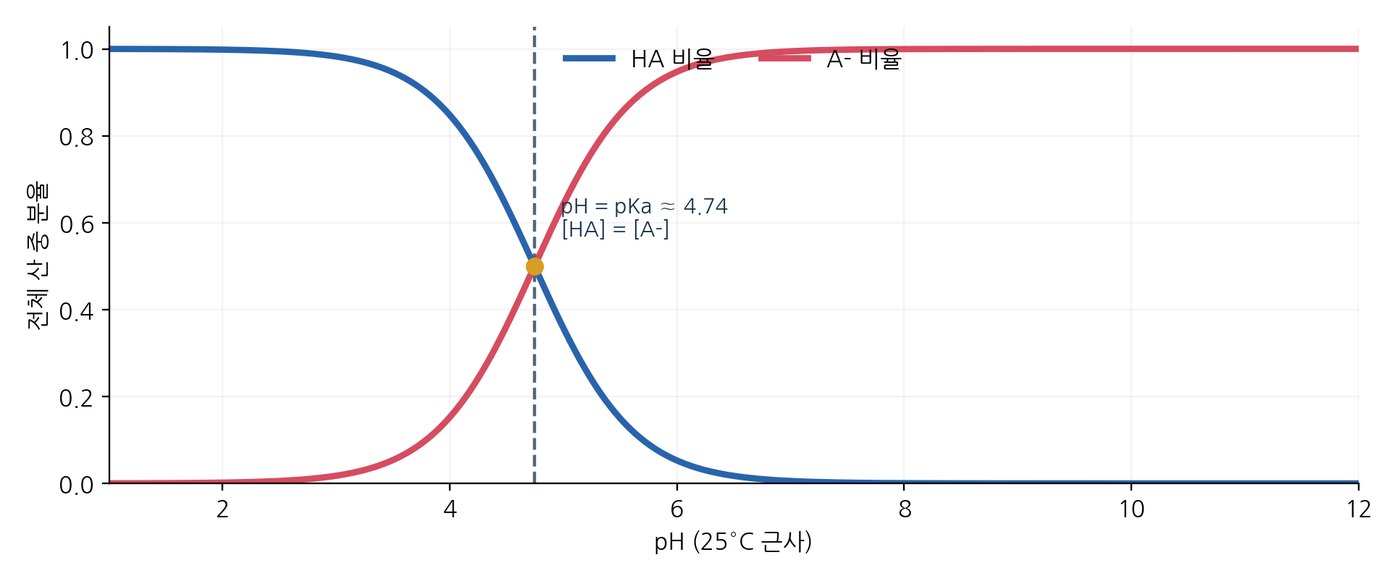
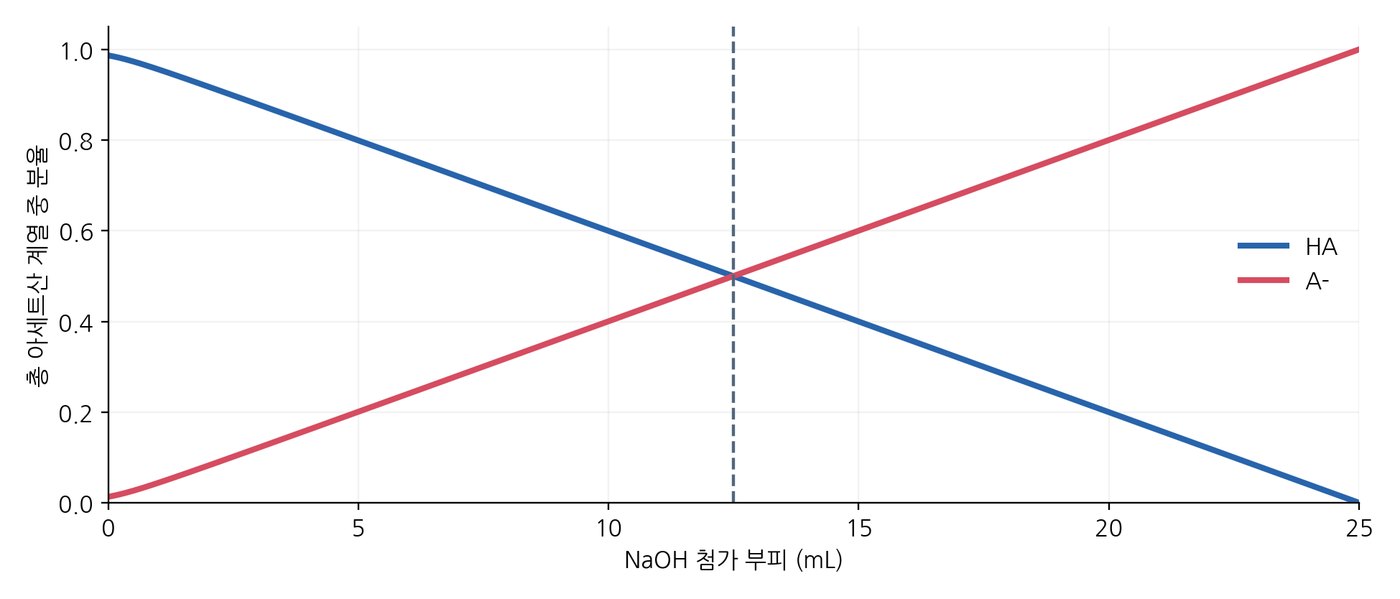
- HA ⇌ H⁺ + A⁻ with Ka = [H⁺][A⁻]/[HA]
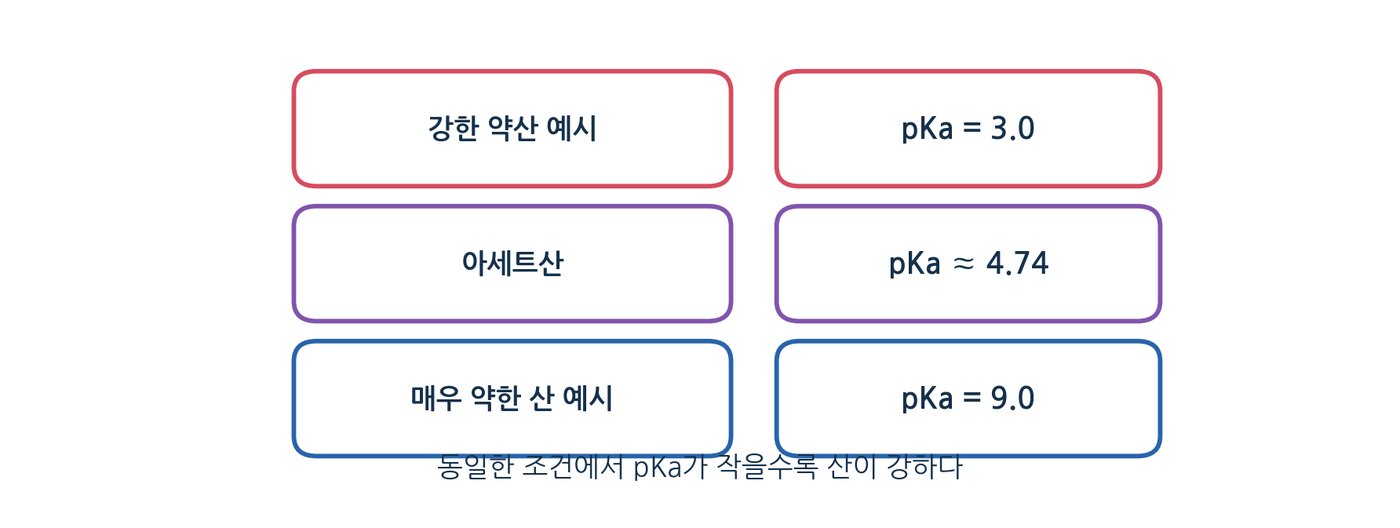
- pKa = −log Ka; a smaller pKa means a stronger acid
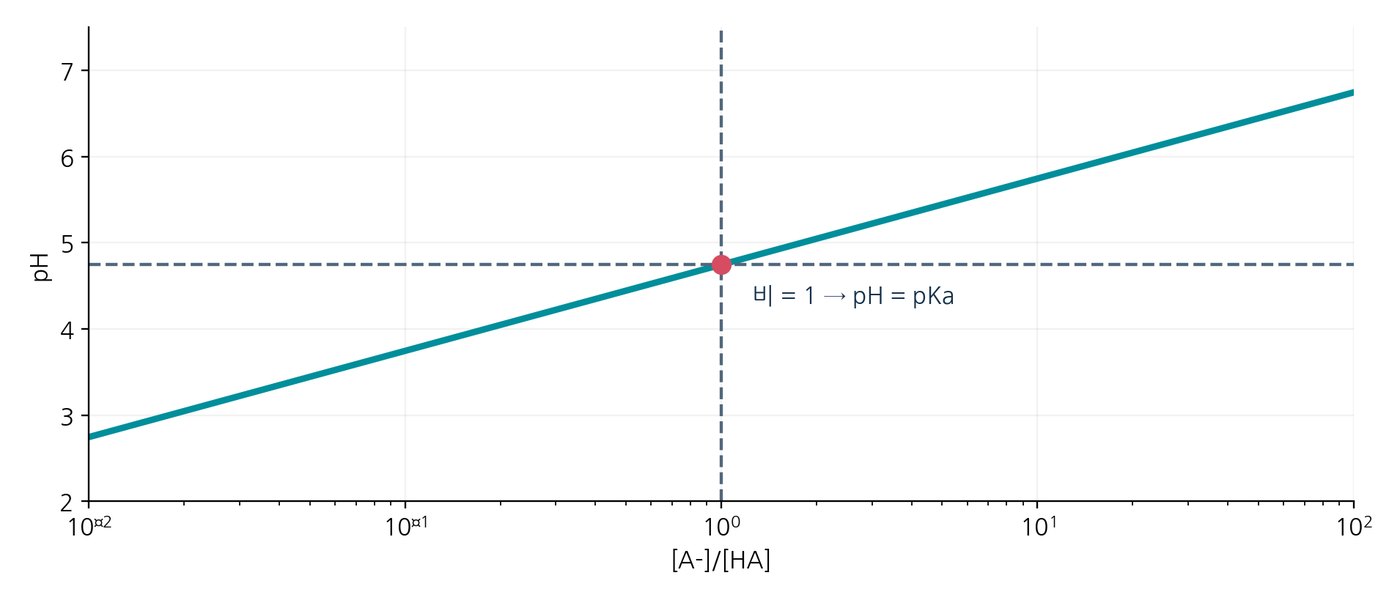
- The fraction protonated follows the Henderson–Hasselbalch relation
05
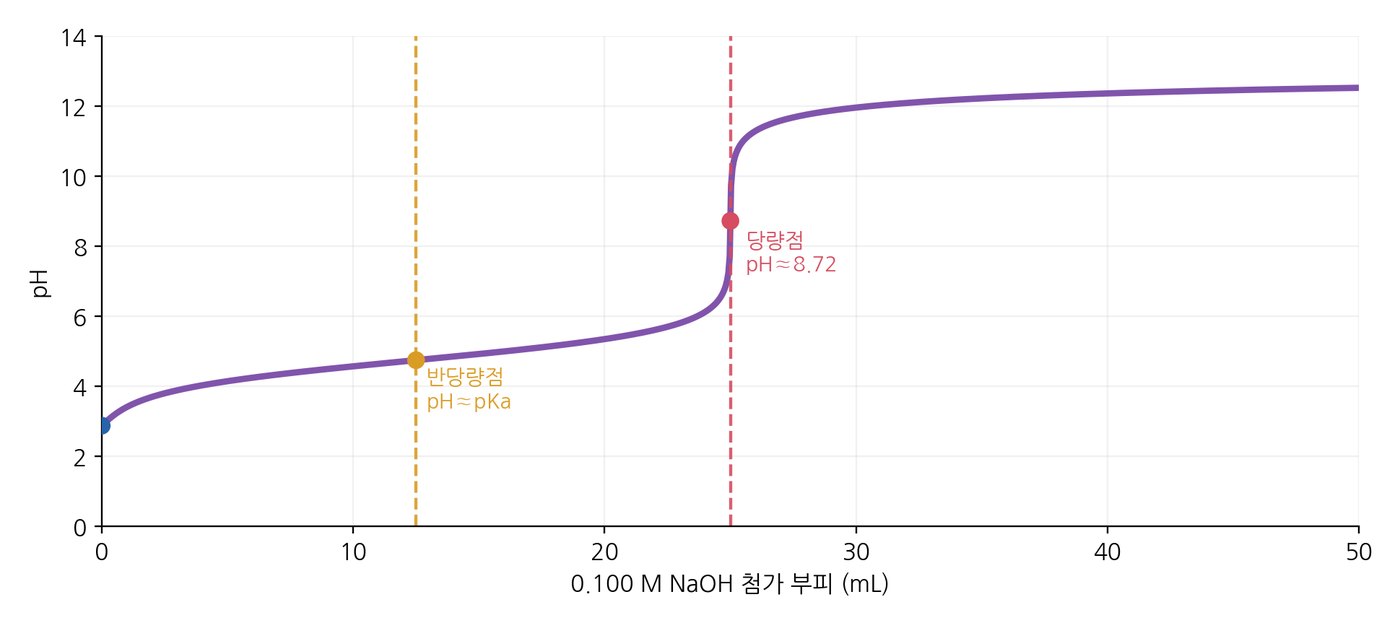
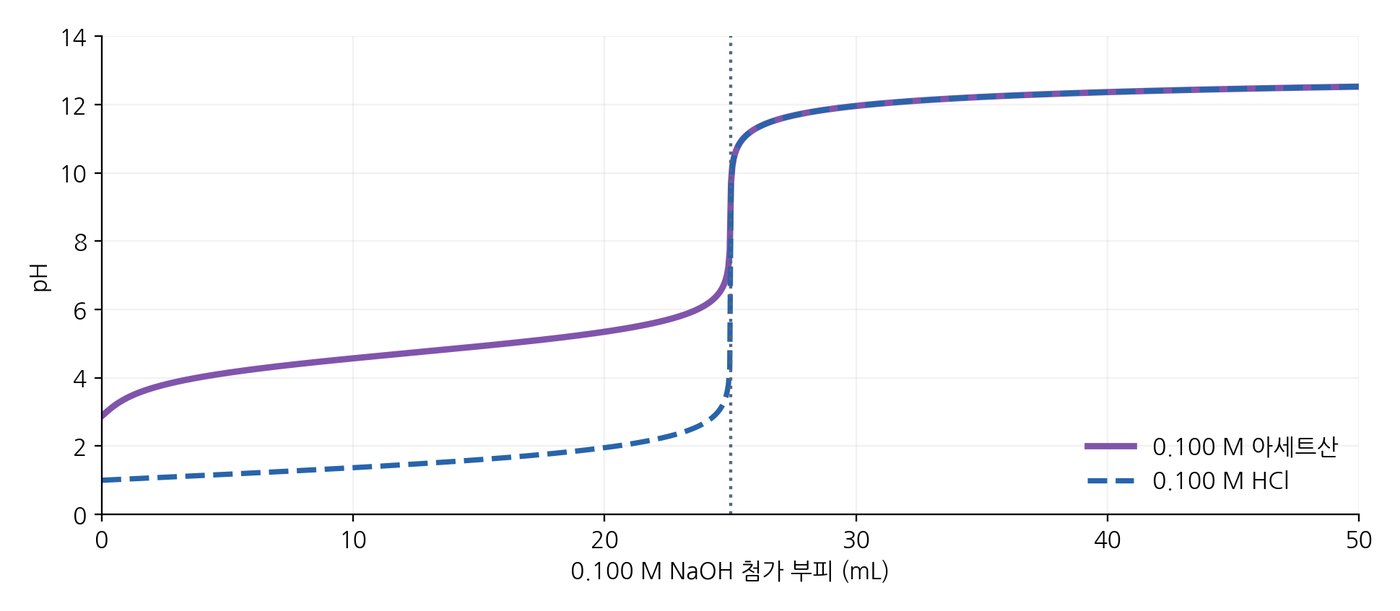
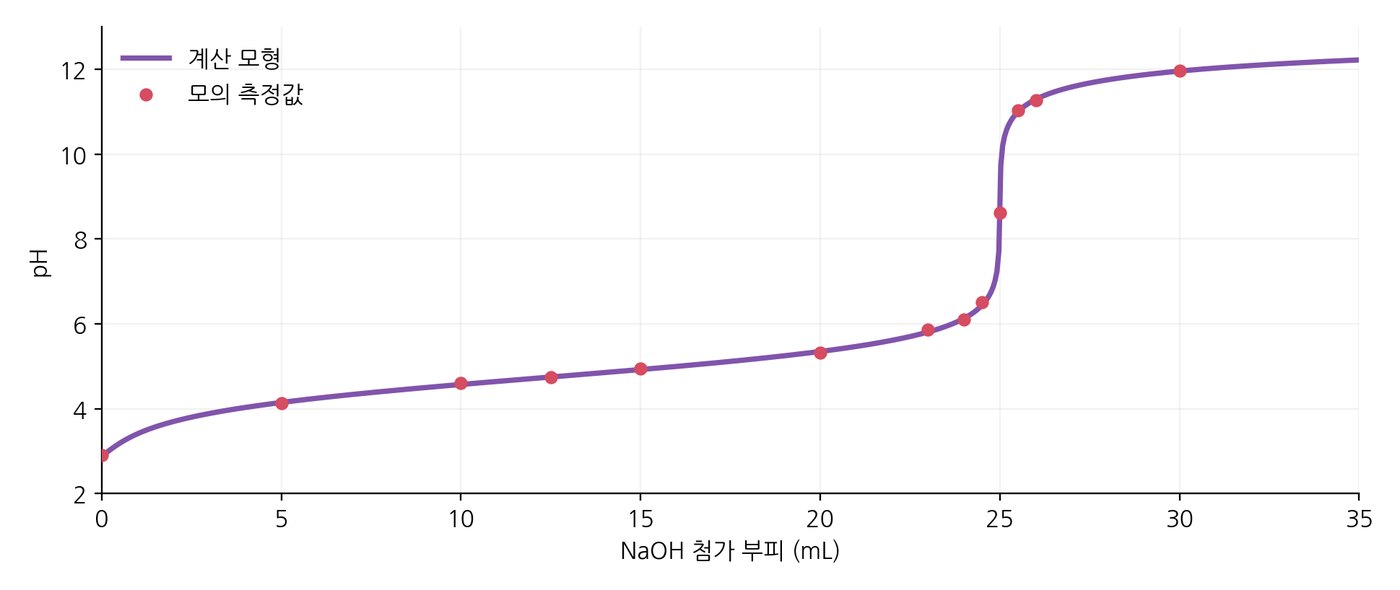
A titration curve reveals the pKa of a weak acid
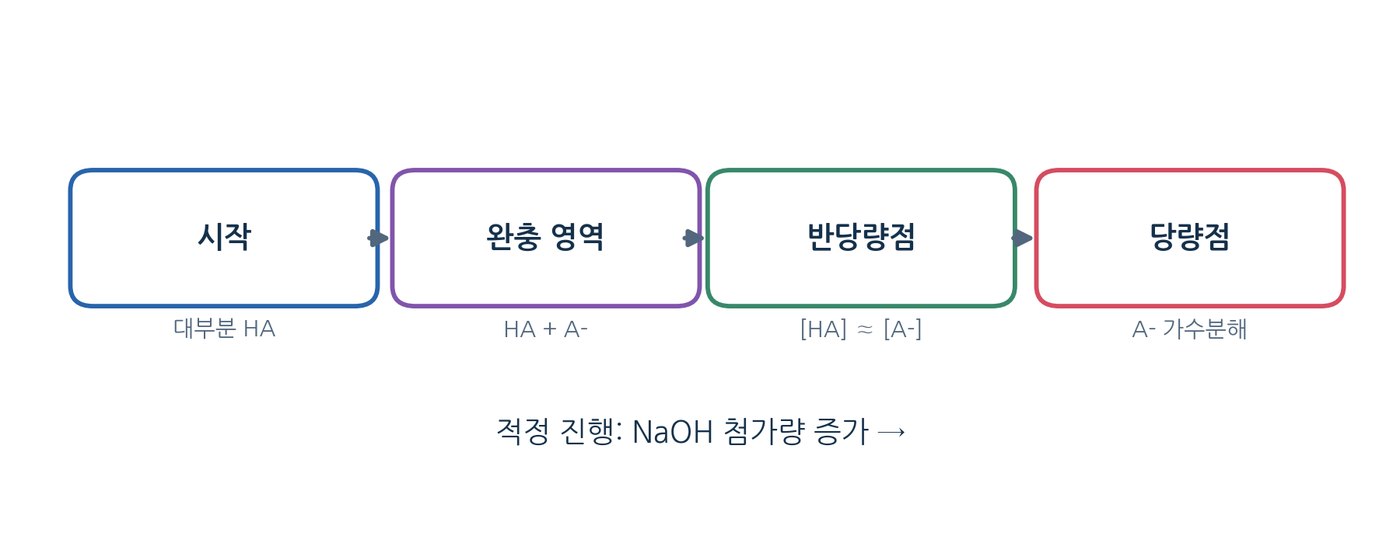
- The curve is shallow near the half-equivalence point, where pH = pKa
- Buffering is strongest at pH values close to pKa
- The equivalence point itself is not the pKa; confusing the two is a common error
References
| Condition | [H₃O⁺] | [OH⁻] | Classification |
|---|---|---|---|
| The two concentrations are equal | √Kw | √Kw | Neutral |
| H₃O⁺ predominates | [H₃O⁺] > [OH⁻] | [OH⁻] < [H₃O⁺] | Acidic |
| OH⁻ predominates | [H₃O⁺] < [OH⁻] | [OH⁻] > [H₃O⁺] | Basic |
| pH at 25 °C | [H₃O⁺] (mol/L) | [OH⁻] (mol/L) | Classification |
|---|---|---|---|
| 2.00 | 1.0×10⁻² | 1.0×10⁻¹² | Acidic |
| 5.00 | 1.0×10⁻⁵ | 1.0×10⁻⁹ | Acidic |
| 7.00 | 1.0×10⁻⁷ | 1.0×10⁻⁷ | Neutral |
| 9.00 | 1.0×10⁻⁹ | 1.0×10⁻⁵ | Basic |
| 12.00 | 1.0×10⁻¹² | 1.0×10⁻² | Basic |
| Acid or conjugate acid | Equilibrium | Typical pKa near 25 °C | Biochemical relevance |
|---|---|---|---|
| Lactic acid | Lactate ⇌ H⁺ + lactate ion | ≈3.86 | Fermentation and metabolism |
| Acetic acid | CH₃COOH ⇌ H⁺ + CH₃COO⁻ | ≈4.74–4.76 | Model weak acid for titration |
| Second dissociation of phosphate | H₂PO₄⁻ ⇌ H⁺ + HPO₄²⁻ | ≈7.2 | Phosphate buffering |
| Ammonium ion | NH₄⁺ ⇌ H⁺ + NH₃ | ≈9.25 | Nitrogen metabolism and acid–base balance |
| State | HA | H₃O⁺ | A⁻ |
|---|---|---|---|
| Initial (mol/L) | C | 0 (approximation) | 0 |
| Change (mol/L) | −x | +x | +x |
| Equilibrium (mol/L) | C−x | x | x |
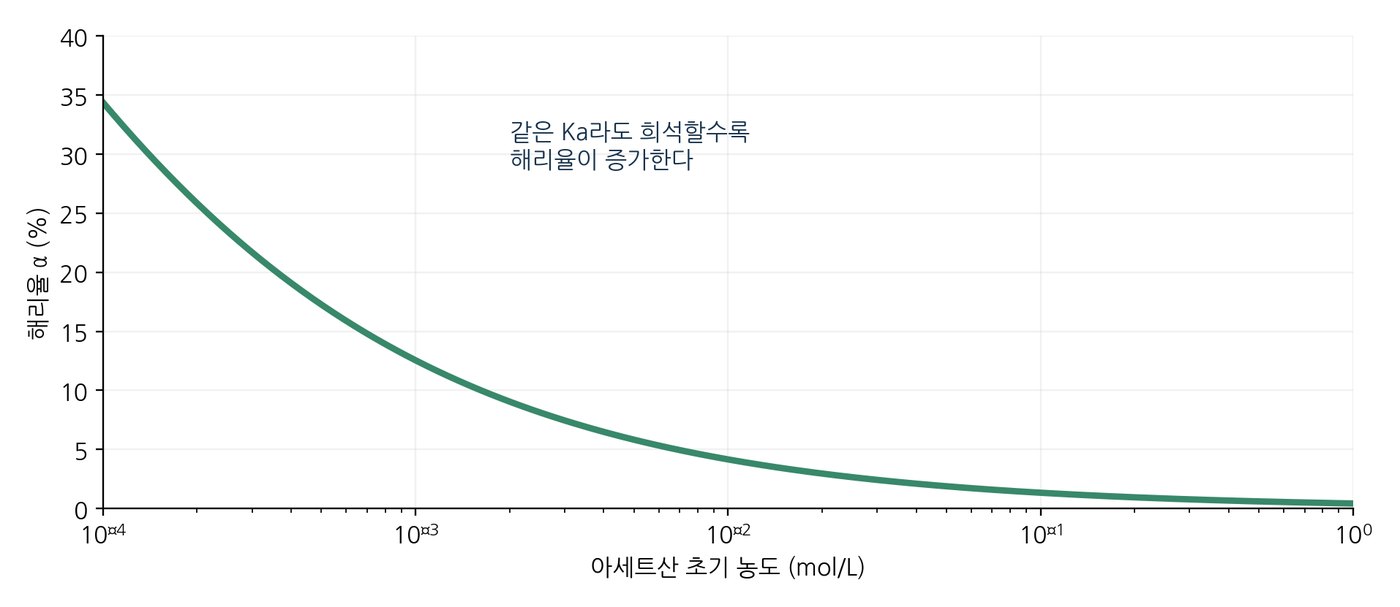
| Initial concentration | Approximate equilibrium [H₃O⁺] | Approximate pH | Approximate dissociation |
|---|---|---|---|
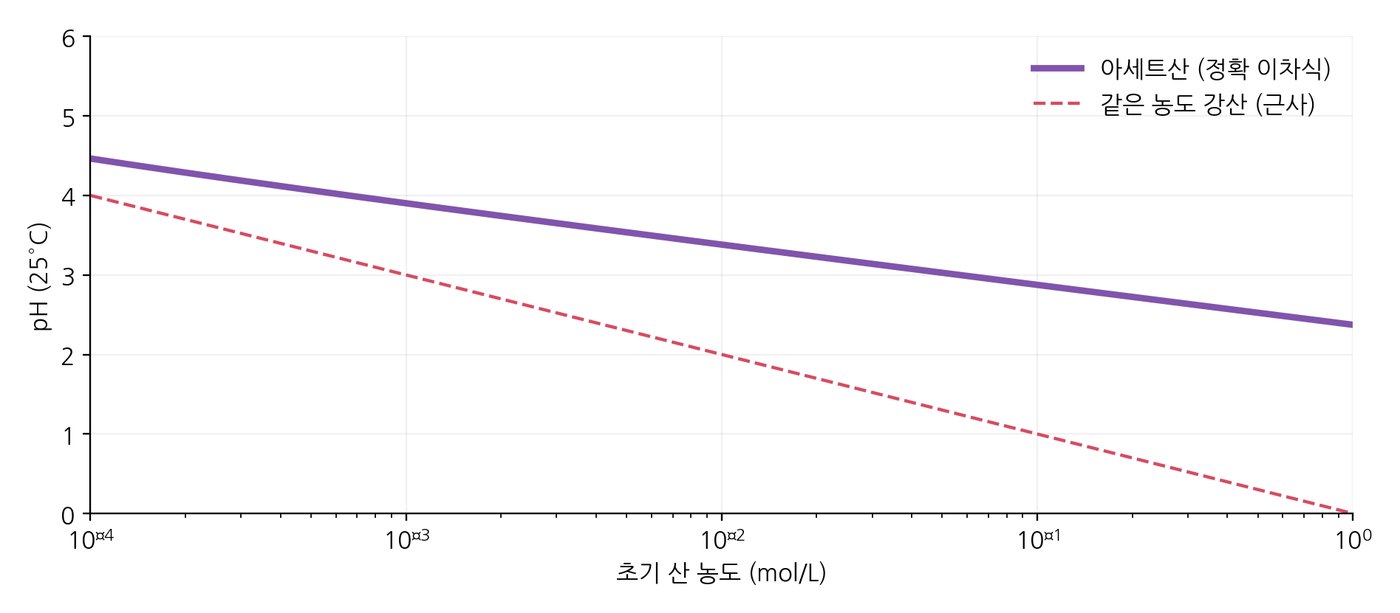
| 0.100 M | 1.33×10⁻³ M | 2.88 | 1.3% |
| 0.0100 M | 4.15×10⁻⁴ M | 3.38 | 4.2% |
| 0.00100 M | 1.25×10⁻⁴ M | 3.90 | 12.5% |
| Volume NaOH (mL) | Calculated pH | Region |
|---|---|---|
| 0.0 | 2.88 | Initial weak acid |
| 5.0 | 4.14 | Buffer region |
| 10.0 | 4.57 | Buffer region |
| 12.5 | 4.75 | Half-equivalence point |
| 20.0 | 5.35 | Buffer region |
| 24.0 | 6.13 | Just before equivalence |
| 25.0 | 8.72 | Equivalence point |
| 26.0 | 11.29 | Past equivalence |
| 30.0 | 11.96 | Excess OH⁻ |