2027 · High School Specialised Subject · Biochemistry
1-3 The Physical Foundations
Energy, entropy, free energy and catalysis
Open systems and steady state, energy and matter conversion, electron flow, entropy, free energy, energy coupling, equilibrium and the reaction quotient, enzyme catalysis, and metabolic economy.
9 SECTIONSOutline notesPrint-readyEnglish edition
01
Living organisms exist in a dynamic steady state, not at equilibrium
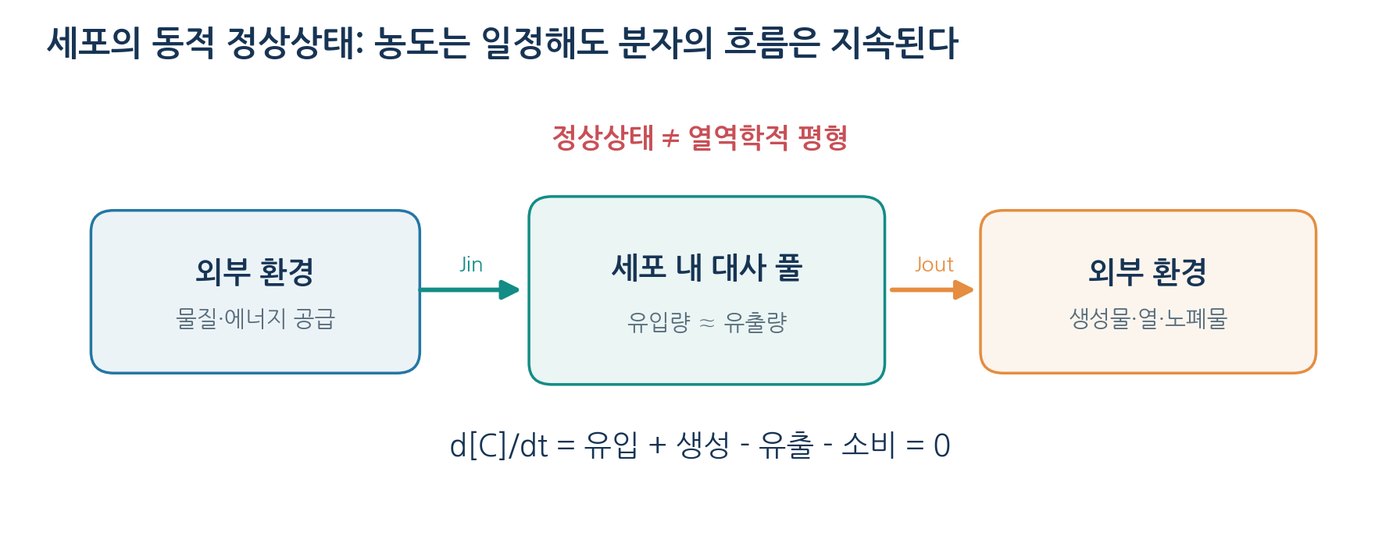
A cell exchanges both matter and energy with its surroundings; constancy of concentration is maintained by continuous flow.
Open system — the cell exchanges matter and energy with its surroundings; the membrane is a selective boundary, not an absolute wall
Energy input — harvested from carbohydrates and lipids or from light; partly spent on ATP synthesis, transport, motility and biosynthesis
Output — heat and waste matter are released back to the surroundings
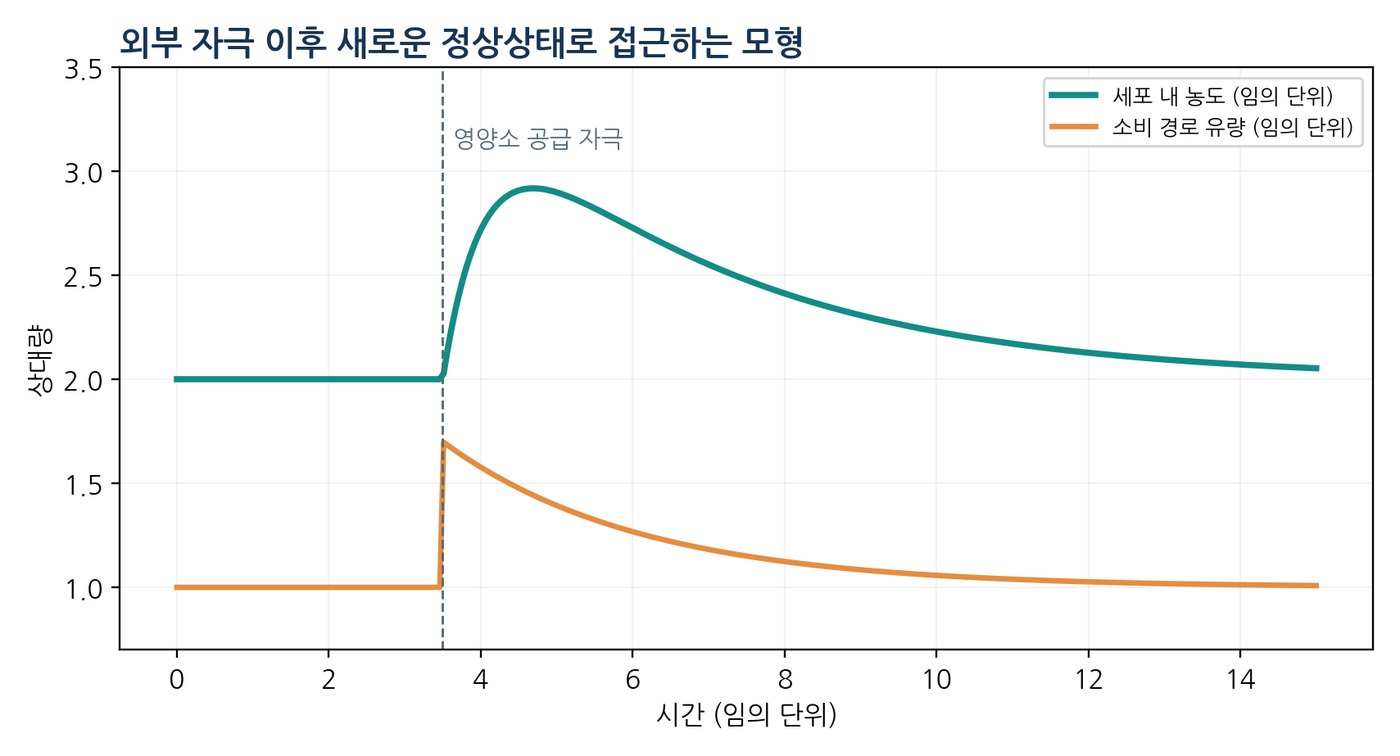
Steady state ≠ equilibrium — in a steady state concentrations barely change while reactions and transport continue; at equilibrium the net driving force ΔG is zero
Material balance — d[C]/dt = Jin − Jout + vproduction − vconsumption
Key point — d[C]/dt = 0 does not mean each flux or rate is zero
Worked example — ATP production 8 and consumption 8 mmol·L⁻¹·min⁻¹ gives d[ATP]/dt = 0; if consumption rises to 11, the pool falls at 3 mmol·L⁻¹·min⁻¹ until regulation raises production
d[C]/dt = Jin − Jout + vproduction − vconsumption
NOTEHomeostasis emphasises the regulation that keeps physiological variables (temperature, pH, blood glucose) within range; steady state describes the temporal stability observed as a result.
Organisms transform energy and matter obtained from the surroundings
Catabolism releases energy and reducing power; anabolism spends them to build cell components.
Metabolism — the network of enzyme-catalysed reactions inside the cell
Catabolism — breaks nutrients into smaller molecules, passes electrons to reduced carriers, and yields energy for ATP synthesis
Anabolism (biosynthesis) — builds amino acids, nucleotides and lipids into cell components, usually consuming ATP and NADPH
First law — energy is neither created nor destroyed, only converted: ΔU = q + w for a closed system
Three kinds of work — chemical (synthesis of protein and DNA), transport (ions moved against a gradient), mechanical (muscle contraction, motor proteins)
Caveat — living systems are open, so the real energy balance includes energy carried by matter crossing the boundary
[Separate note 1-3] Entropy: the advantage of disorder
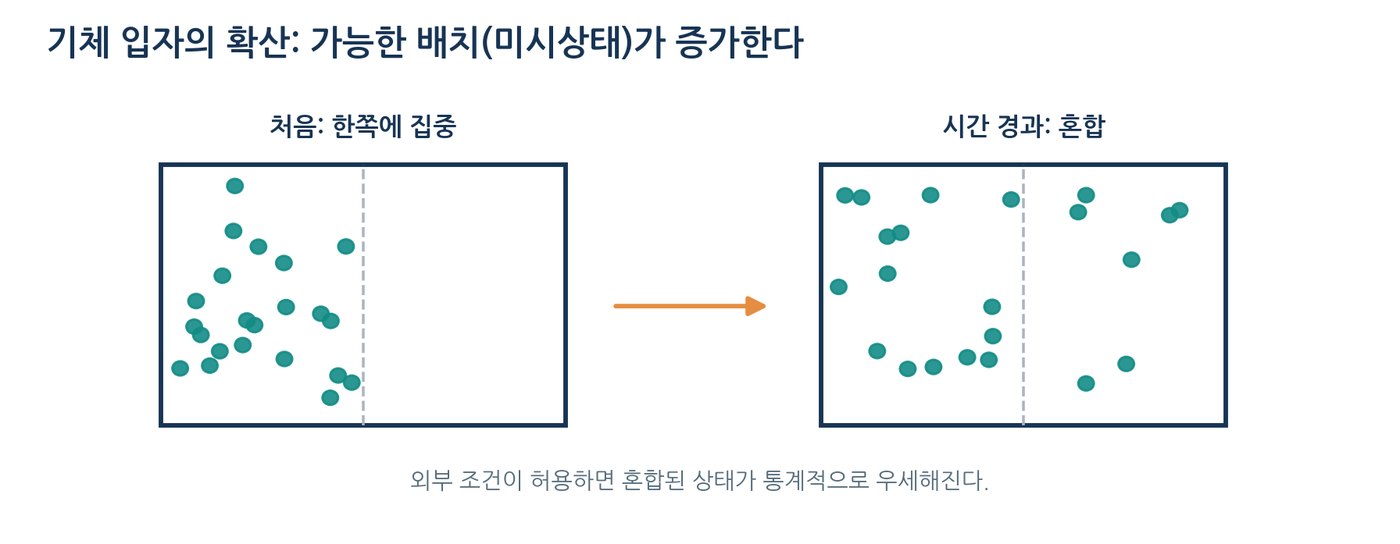
Entropy counts the microscopic arrangements consistent with a macroscopic state — not simply "tidiness".
Boltzmann relation — S = kB ln Ω links entropy to the number of microstates
What changes entropy — heat flow, mixing, concentration change, and changes in molecular degrees of freedom
Second law — ΔStotal = ΔSsystem + ΔSsurroundings ≥ 0 for a spontaneous process in an isolated whole
Why cells do not violate it — a cell maintains internal order by consuming nutrients and releasing heat and waste, which raises the entropy of the surroundings
Common error — concluding "order increased, therefore impossible". Spontaneity is judged by ΔStotal, or by ΔG at constant temperature and pressure
Thought experiment — separating a mixed solution generally requires work; selective membrane transport is how the cell sustains such gradients
S = kB ln Ω
ΔStotal = ΔSsystem + ΔSsurroundings ≥ 0
NOTEDo not judge spontaneity from the sign of ΔS of the system alone. A living cell is an open system, so the exchange of energy and matter must be included.
An unfavourable reaction proceeds only when it shares a reaction pathway with a favourable one.
Coupling — a common intermediate or a shared structural change connects the two reactions
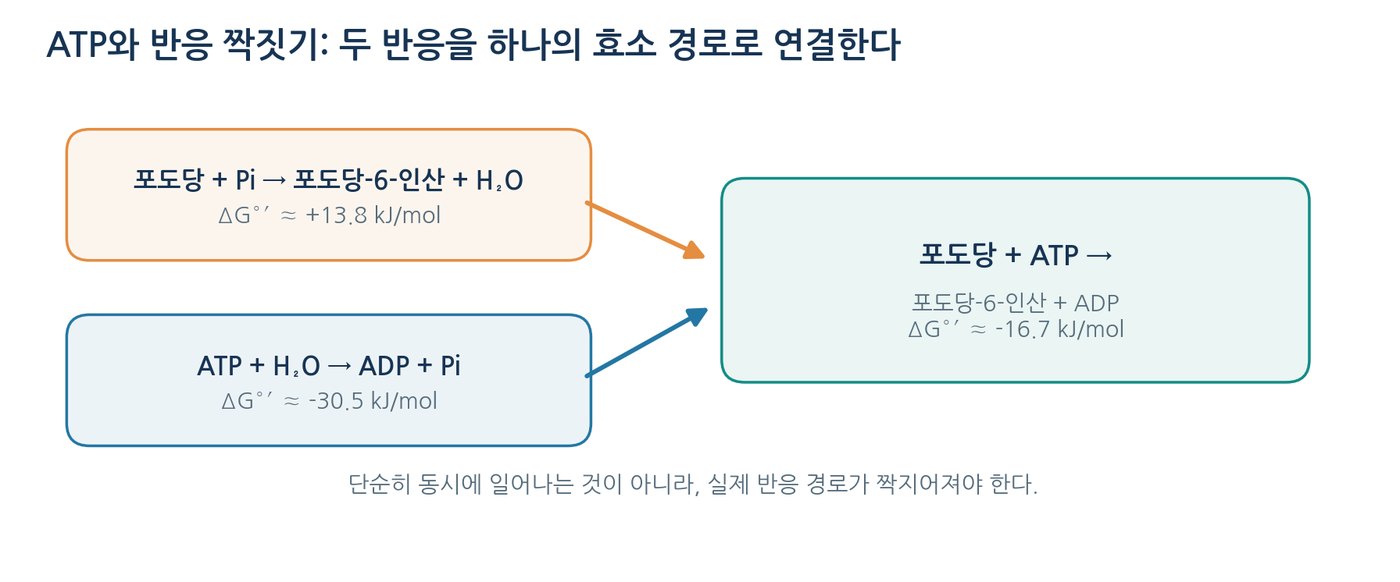
Additivity — for reactions that form one pathway, ΔGoverall = ΔG₁ + ΔG₂
Not additivity by proximity — two reactions merely occurring in the same tube do not drive each other
Glucose phosphorylation — hexokinase transfers the γ-phosphate of ATP to glucose, making the overall path favourable
ATP hydrolysis — ΔG°′ ≈ −30.5 kJ/mol is commonly quoted at about 25 °C; the real value depends on pH, Mg²⁺ and ionic strength
Misconception — "breaking a bond releases energy" is inaccurate: the net free-energy change comes from resonance stabilisation, hydration, ionisation and entropy of the products
Other currencies — the H⁺ electrochemical gradient, NADPH reducing power, and Na⁺ or H⁺ symport/antiport
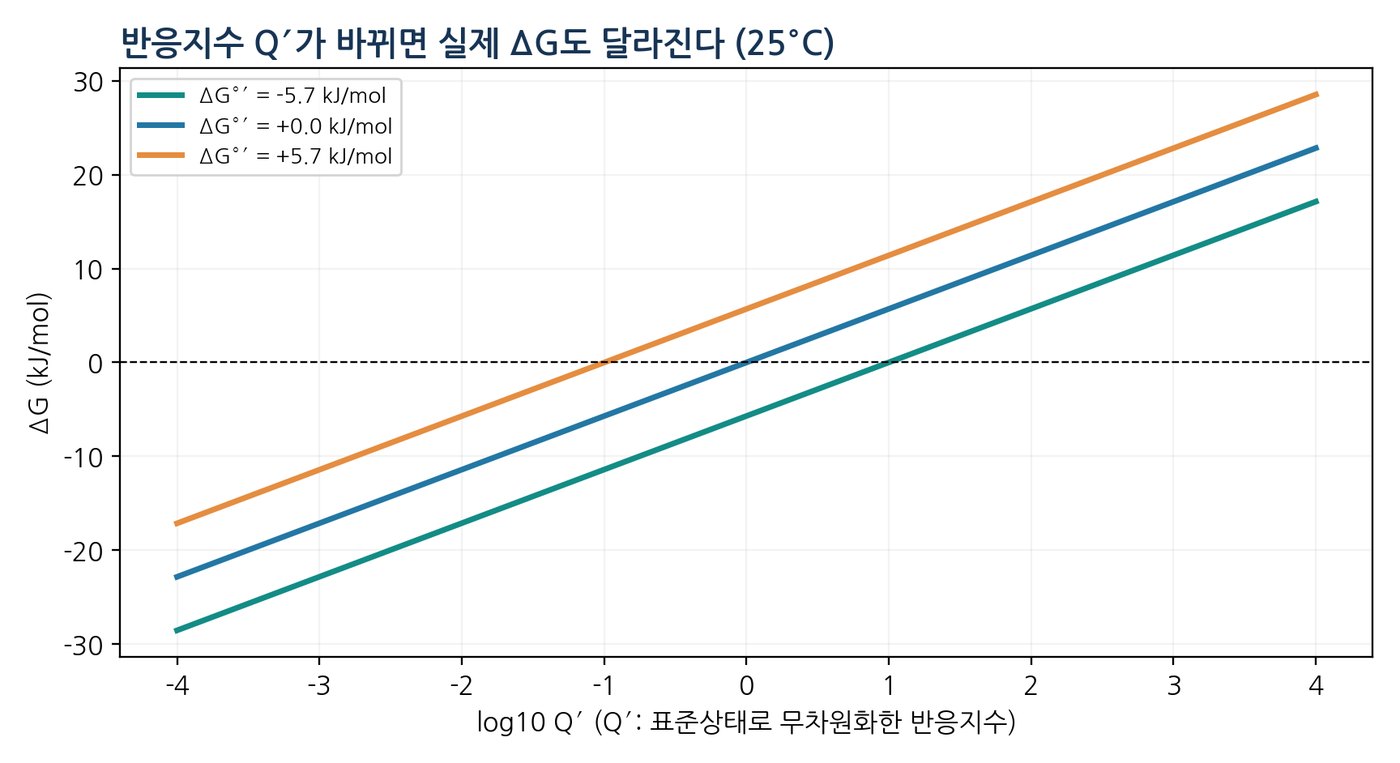
Worked example — ΔG°′ = +5.71 kJ/mol with Q′ = 0.010 gives ΔG = 5.71 − 11.42 ≈ −5.71 kJ/mol: an unfavourable standard reaction running forward because products are scarce
ΔG = ΔG°′ + RT ln Q′
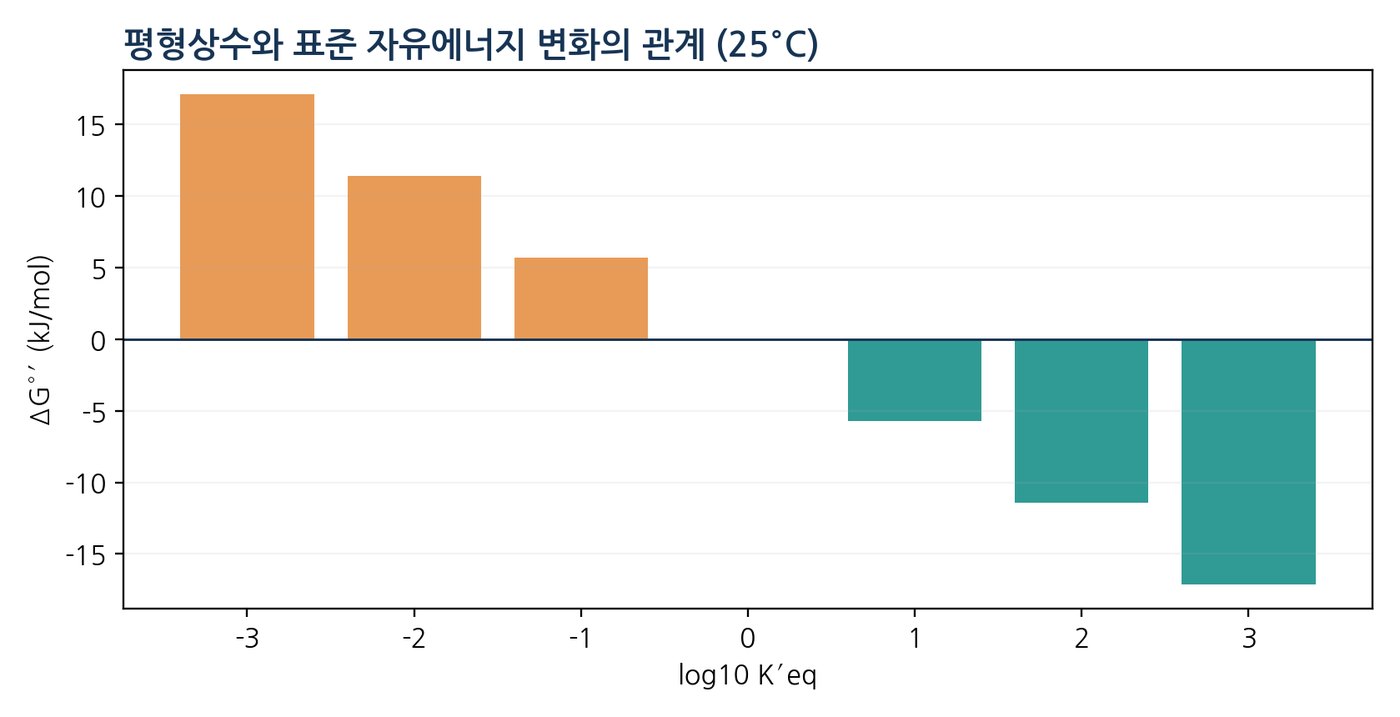
ΔG°′ = −RT ln K′eq
NOTEK′eq is an equilibrium composition, not a rate constant. When using log₁₀, convert with 2.303RT. Doubling the equation doubles ΔG°′ and squares K′eq.
Enzymes lower the activation barrier; they do not change ΔG or the equilibrium constant.
Mechanism — stabilise the transition state or provide an alternative pathway, lowering ΔG‡
Both directions — forward and reverse rates are accelerated equally, so K′eq is unchanged
Active site — binds substrate and positions catalytic groups; uses electrostatics, hydrogen bonding, acid–base, covalent and metal-ion catalysis
Induced fit — enzyme and substrate structures can change on binding; not every enzyme uses the same mechanism
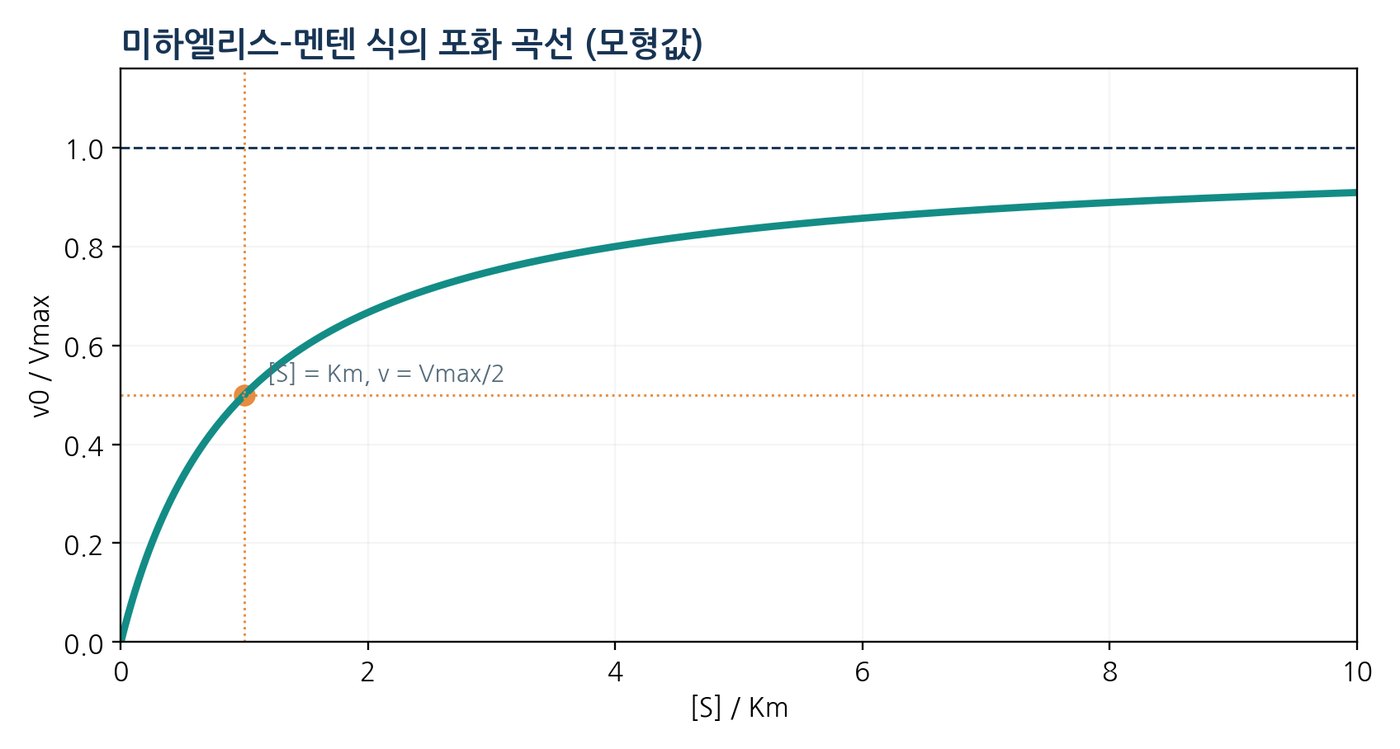
Michaelis–Menten — v₀ = Vmax[S] / (Km + [S]) for initial rates with negligible reverse reaction
Km — the substrate concentration giving v₀ = Vmax/2; only under special conditions does it approximate a dissociation constant
Pathways and bottlenecks — flux through A → B → C depends on each enzyme, substrate supply and product removal; do not assume the first enzyme is always rate-limiting
v₀ = Vmax[S] / (Km + [S])
NOTEΔG answers whether a reaction is favourable; ΔG‡ and rate constants answer how fast it goes. Different questions, different quantities.
Breaks complex molecules to obtain precursors and energy
Joins small molecules to build cell components
Electron carriers
NAD⁺ → NADH and other reduced forms
NADPH → NADP⁺ and other reducing power consumed
Energy
Favourable reactions linked to ATP production
ATP input and reaction coupling
Examples
Glycolysis, fatty acid β-oxidation
Biosynthesis of protein, fatty acid and nucleic acid
Table 1.3-3Interpreting the sign of ΔG
Sign of ΔG
Direction at the current composition
Caution
ΔG < 0
Forward reaction favoured
Does not mean the reaction is fast
ΔG = 0
Equilibrium; no net driving force
Molecular motion and both directions continue
ΔG > 0
Reverse reaction favoured
Coupling to another reaction can still drive the overall process
Table 1.3-4Reaction quotient, free energy and direction
State
Comparison
Free energy
Favoured direction
More reactant than at equilibrium
Q′ < K′eq
ΔG < 0
Forward
At equilibrium
Q′ = K′eq
ΔG = 0
No net change
More product than at equilibrium
Q′ > K′eq
ΔG > 0
Reverse
Table 1.3-5Michaelis–Menten relative velocity
[S] / Km
v₀ / Vmax
Interpretation
0.25
0.200
Low substrate; a large effect from adding more
0.50
0.333
Sensitive to substrate increase
1.00
0.500
Km corresponds to half-maximal velocity
2.00
0.667
Approaching saturation
4.00
0.800
Diminishing additional effect
10.00
0.909
Close to Vmax
Table 1.3-6Timescales of metabolic regulation
Mechanism
Approximate timescale
Main features
Change in substrate or product concentration
Seconds to minutes
Immediate change in Q′ and rate
Allosteric binding
Very fast
Reversible switching of enzyme activity
Covalent modification such as phosphorylation
Seconds to minutes
Changes in activity and interactions
Change in enzyme amount through transcription and translation
Minutes to hours or more
Longer-term change in metabolic capacity
Organelle and compartment structure
Persistent and dynamic
Access of reactants; separation and linking of pathways
Table 1.3-7Enzyme activity by condition (record sheet)
Condition
Run 1
Run 2
Run 3
Mean
Interpretation
A: baseline
B: increased enzyme
C: heat-treated
Table 1.3-8Reaction quotient and free energy at 25 °C (ΔG°′ = +5.71 kJ/mol)
Q′
ln Q′
RT ln Q′ (kJ/mol)
ΔG (kJ/mol)
Forward direction
0.001
−6.908
−17.12
−11.41
Favoured
0.010
−4.605
−11.42
−5.71
Favoured
0.100
−2.303
−5.71
0.00
At equilibrium
1.000
0.000
0.00
+5.71
Unfavourable
10.000
+2.303
+5.71
+11.42
Unfavourable
Table 1.3-1Open, closed and isolated systems
System type
Exchange with surroundings
Examples
Open
Both matter and energy
Living cells, plant leaves
Closed
Energy but not matter
An idealised reaction vessel
Isolated
Neither matter nor energy
A perfectly isolated system is an idealisation
Table 1.3-2Catabolism and anabolism compared
Basis
Catabolism
Anabolism
Main role
Breaks complex molecules to obtain precursors and energy
Joins small molecules to build cell components
Electron carriers
NAD⁺ → NADH and other reduced forms
NADPH → NADP⁺ and other reducing power consumed
Energy
Favourable reactions linked to ATP production
ATP input and reaction coupling
Examples
Glycolysis, fatty acid β-oxidation
Biosynthesis of protein, fatty acid and nucleic acid
Table 1.3-3Interpreting the sign of ΔG
Sign of ΔG
Direction at the current composition
Caution
ΔG < 0
Forward reaction favoured
Does not mean the reaction is fast
ΔG = 0
Equilibrium; no net driving force
Molecular motion and both directions continue
ΔG > 0
Reverse reaction favoured
Coupling to another reaction can still drive the overall process
Table 1.3-4Reaction quotient, free energy and direction
State
Comparison
Free energy
Favoured direction
More reactant than at equilibrium
Q′ < K′eq
ΔG < 0
Forward
At equilibrium
Q′ = K′eq
ΔG = 0
No net change
More product than at equilibrium
Q′ > K′eq
ΔG > 0
Reverse
Table 1.3-5Michaelis–Menten relative velocity
[S] / Km
v₀ / Vmax
Interpretation
0.25
0.200
Low substrate; a large effect from adding more
0.50
0.333
Sensitive to substrate increase
1.00
0.500
Km corresponds to half-maximal velocity
2.00
0.667
Approaching saturation
4.00
0.800
Diminishing additional effect
10.00
0.909
Close to Vmax
Table 1.3-6Timescales of metabolic regulation
Mechanism
Approximate timescale
Main features
Change in substrate or product concentration
Seconds to minutes
Immediate change in Q′ and rate
Allosteric binding
Very fast
Reversible switching of enzyme activity
Covalent modification such as phosphorylation
Seconds to minutes
Changes in activity and interactions
Change in enzyme amount through transcription and translation
Minutes to hours or more
Longer-term change in metabolic capacity
Organelle and compartment structure
Persistent and dynamic
Access of reactants; separation and linking of pathways
Table 1.3-7Enzyme activity by condition (record sheet)
Condition
Run 1
Run 2
Run 3
Mean
Interpretation
A: baseline
B: increased enzyme
C: heat-treated
Table 1.3-8Reaction quotient and free energy at 25 °C (ΔG°′ = +5.71 kJ/mol)
Q′
ln Q′
RT ln Q′ (kJ/mol)
ΔG (kJ/mol)
Forward direction
0.001
−6.908
−17.12
−11.41
Favoured
0.010
−4.605
−11.42
−5.71
Favoured
0.100
−2.303
−5.71
0.00
At equilibrium
1.000
0.000
0.00
+5.71
Unfavourable
10.000
+2.303
+5.71
+11.42
Unfavourable
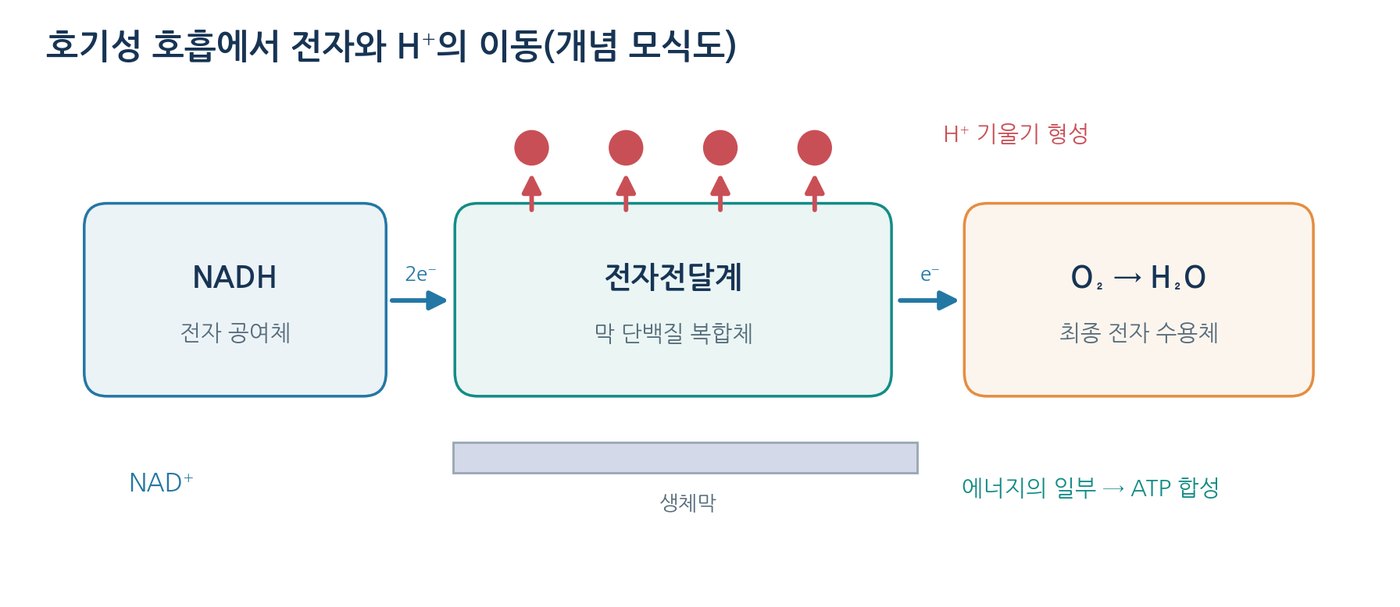
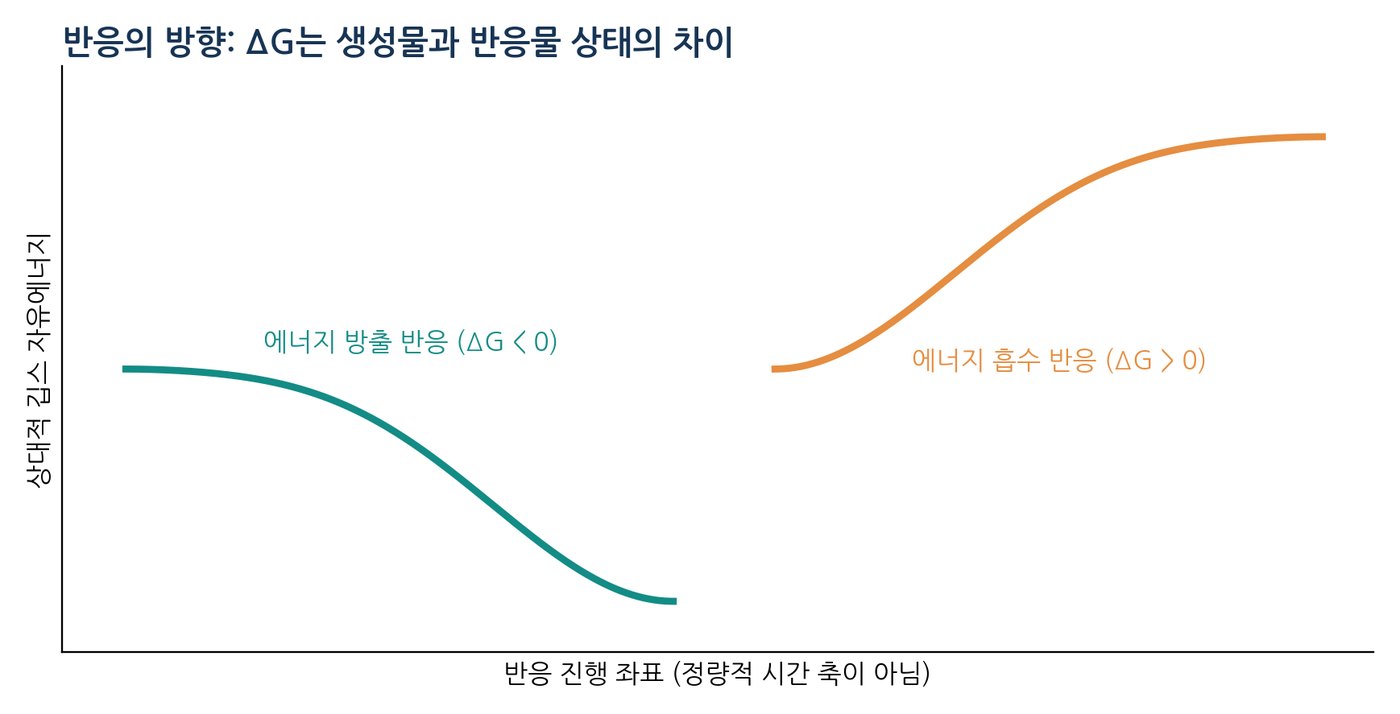
Figure 1.3-1Biomolecules convert energy and pass electrons so the cell can do chemical and transport work.Figure 1.3-4Three forms of work a cell performs: chemical, transport and mechanical.Figure 1.3-5Electron transfer chain, proton gradient and ATP synthesis.Figure 1.3-6Entropy and the statistical picture of molecular dispersal.Figure 1.3-7Free-energy difference before and after a reaction; the reaction coordinate is not time.Figure 1.3-8Phosphorylation of glucose: energy balance of ATP coupling.Figure 1.3-9Free energy as a function of the reaction quotient for three values of ΔG°′.Figure 1.3-11Enzymes lower the activation barrier without changing ΔG.Figure 1.3-13Negative feedback inhibition of a biosynthetic pathway by its end product.